
As we navigate through 2025, Chainlink (LINK) continues to demonstrate its resilience as one of the most crucial pieces of blockchain infrastructure. Currently trading around $22.40 USD with a recent 2.73% gain, the oracle network’s native token faces critical technical levels that could determine its trajectory for the remainder of the year.
The cryptocurrency market’s leading decentralized oracle solution has captured significant attention from both institutional investors and retail traders. With a current price of $22.83 USD and 24-hour trading volume exceeding $1.24 billion, LINK’s price action reveals compelling patterns that demand careful analysis.
This comprehensive Chainlink price chart analysis will dissect the most important support and resistance levels, examine current market dynamics, and provide actionable insights for navigating LINK’s price movements throughout 2025.
Current Market Position and Price Overview
LINK’s Present Trading Range
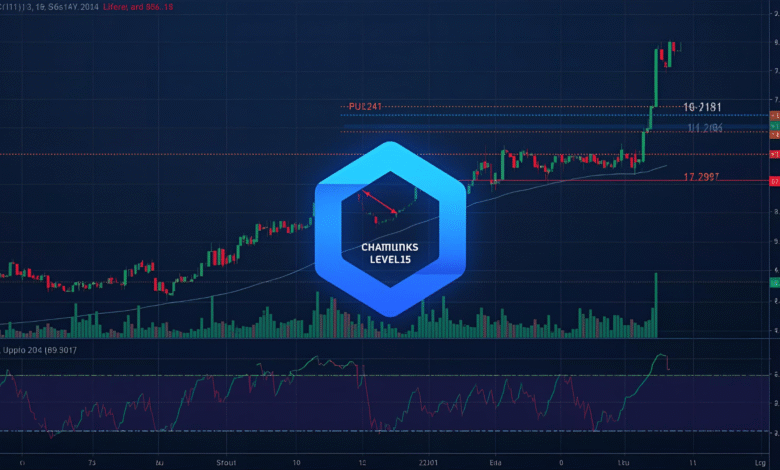
Chainlink (LINK) is currently in a consolidation phase, with key support at $22.91 and resistance at $24.76. This relatively narrow trading range has defined much of LINK’s recent price action, creating opportunities for both breakout and breakdown scenarios.
Key Current Metrics:
- Current Price: $22.40 – $22.83 USD
- Market Cap: Approximately $15.77 billion
- 24-Hour Trading Volume: $1.24+ billion
- Market Ranking: 12th-13th largest cryptocurrency
Market Sentiment Analysis
The current Chainlink sentiment is neutral according to technical analysis, with the Fear & Greed Index standing at 46, indicating investors’ sentiment is in the Fear zone. This neutral-to-fearful sentiment often precedes significant price movements, making technical levels even more critical for traders and investors.
Critical Support Levels for 2025
Primary Support Zone: $22-$24
The most immediate and crucial support zone for Chainlink price analysis lies between $22 and $24. If LINK remains above $24 support, the following resistance zones will be around $28 and $30. However, failure to maintain this level could trigger more significant downside movement.
Key Support Levels Breakdown:
| Support Level | Strength | Significance |
|---|---|---|
| $22.91 | Strong | Current consolidation floor |
| $22.00 | Critical | Psychological round number |
| $20.00 | Major | Strong moving average support |
| $17.42 | Long-term | Technical analysis minimum for 2025 |
Secondary Support at $20
If the $24 level is not maintained, a fall in price could be envisaged back to $22 or $20, where there is strong moving average support. The $20 level represents a confluence of technical factors:
- 200-day moving average convergence
- Historical support from previous consolidations
- Psychological significance as a round number
Long-Term Support Floor: $17-$18
In 2025, Chainlink is forecasted to move between $17 and $44, establishing the $17 level as a potential long-term floor. This represents the absolute downside target for the most bearish scenarios in 2025.
Key Resistance Levels and Breakout Targets
Immediate Resistance: $24.76-$25
While the short-term outlook shows downward pressure, a breakout above resistance could signal bullish momentum. The immediate resistance at $24.76 serves as the first hurdle for any meaningful upward movement.
Major Resistance Zone: $27-$30
The $27-$30 resistance zone represents the most significant price barrier for LINK in 2025:
- $27.87: Immediate resistance that may trigger a pullback to $22 support
- $28.00: Primary resistance zone with 15% rally potential
- $30.00: Major psychological resistance with 24% upside potential
Extended Targets: $35-$44
For the most bullish scenarios, Chainlink price predictions suggest potential moves toward:
- $35-$38: Experts forecast maximum prices of $38.26 by the end of 2025
- $44: Upper bound of 2025 forecasted range
Resistance Level Summary:
| Resistance Level | Probability | Upside Potential |
|---|---|---|
| $24.76 | High | 8% from the current |
| $27.87 | Medium | 24% from current |
| $30.00 | Medium | 33% from the current |
| $38.26 | Low | 70% of the current |
| $44.00 | Very Low | 95+ from current |
Technical Analysis Deep Dive
Moving Average Analysis
Chainlink’s 200-day moving average is sloping up and has been doing so since January 5, 2025, which means the trend is strong. The 200-day moving average is currently below the price, which means that if the price interacts with it again, it can potentially be used as support.
Moving Average Levels:
- 50-day MA: Approximately $23.50 (dynamic resistance)
- 100-day MA: Around $21.80 (intermediate support)
- 200-day MA: Near $20.00 (major support trend)
Chart Pattern Recognition
The technical chart on the weekly timeframe shows a bullish engulfing pattern, which suggests strong momentum favoring buyers. This pattern indicates potential continuation of upward movement, provided key resistance levels are breached.
Current Patterns:
- Bullish Engulfing: Weekly timeframe showing buyer strength
- Consolidation Triangle: Narrowing range between $22.91 and $24.76
- Volume Profile: Strong support around $22-23 price area
Momentum Indicators
The current momentum indicators present mixed signals:
- RSI: Neutral zone around 45-55
- MACD: Slightly bearish with potential for bullish crossover
- Volume: Above average, indicating active participation
Price Predictions and Expert Forecasts for 2025
Conservative Predictions
According to the technical analysis of prices expected in 2025, the minimum cost will be $17.42. The maximum level that the LINK price can reach is $21.14, with an average trading price expected around $19-20 range for conservative estimates.
Moderate Predictions
Based on algorithmically generated price predictions, the price of LINK is expected to increase by 7.65% in the next month and reach $24.60, with a 19.16% gain forecasted in the next six months to reach $27.23.
Bullish Scenarios
The most optimistic Chainlink price analysis suggests:
- Short-term: Potential 24% upside to $30 within 4 weeks
- Medium-term: $30.69 to $38.26 by the end of 2025
- Long-term: New all-time highs expected in the 2026-2028 period
Factors Influencing Price Predictions
Bullish Catalysts:
- Increasing adoption of decentralized oracle solutions
- A growing DeFi ecosystem requires reliable price feeds
- Integration with major blockchain networks
- Institutional adoption of LINK tokens
Bearish Risks:
- Overall cryptocurrency market volatility
- Regulatory challenges in key markets
- Competition from alternative Oracle solutions
- Macroeconomic headwinds affecting risk assets

Trading Strategies Based on Support and Resistance
Range Trading Strategy
With LINK consolidating between $22.91 and $24.76, traders can implement range-bound strategies:
Entry Points:
- Buy: Near $22.91 support with stop loss at $21.50
- Sell: Near $24.76 resistance with stop loss at $25.50
Risk Management:
- Position size: 2-3% of portfolio per trade
- Risk-reward ratio: Minimum 1:2
- Time horizon: 2-4 weeks per cycle
Breakout Trading Strategies
Bullish Breakout Above $25
Setup Requirements:
- Close above $24.76 on increasing volume
- Retest of $24.76 as support
- Momentum indicators are showing bullish signals
Targets:
- First target: $27.87
- Second target: $30.00
- Extended target: $35.00
Bearish Breakdown Below $22
Setup Requirements:
- Close below $22.91 on high volume
- Failed retest of $22.91 as resistance
- Momentum indicators confirming weakness
Targets:
- First target: $20.00
- Second target: $18.00
- Extended target: $17.42
Long-term Investment Approach
For long-term investors focused on Chainlink price chart analysis:
Accumulation Zones:
- Primary: $20.00 – $22.00
- Secondary: $17.42 – $18.00
- Aggressive: Current levels around $22-23
Distribution Zones:
- Conservative: $30.00 – $32.00
- Moderate: $35.00 – $38.00
- Aggressive: $40.00+
Market Fundamentals Supporting Technical Analysis
Network Growth Metrics
Chainlink’s fundamental strength supports the technical outlook:
- Active Oracle networks: Continuously expanding
- Total value secured: Multi-billion dollar milestone
- Developer activity: Consistently high GitHub activity
- Partnership announcements: Regular enterprise integrations
Competitive Position
Chainlink remains a strong player in the decentralized oracle space, maintaining its leadership position despite increasing competition. This fundamental strength provides underlying support for technical price levels.
Institutional Adoption Trends
Chainlink’s impressive 426% five-year growth and recent 40.64% surge underscore its pivotal role in blockchain infrastructure. With a $10.45 billion market cap ranking 12th globally, LINK demonstrates strong market positioning.
Risk Management and Portfolio Considerations
Position Sizing Guidelines
Based on volatility analysis and support/resistance levels:
Conservative Allocation: 1-2% of portfolio
- Focus on $20-22 accumulation zone
- Long-term holding strategy
- Dollar-cost averaging approach
Moderate Allocation: 3-5% of portfolio
- Trading between support and resistance
- Swing trading 2-6 week timeframes
- Technical indicator-based entries
Aggressive Allocation: 5-10% of portfolio
- Breakout trading strategies
- Leveraged positions (with proper risk controls)
- Active day trading approaches
Risk Mitigation Strategies
Stop Loss Placement:
- Support-based stops: 2-3% below key support levels
- Time-based stops: Exit if consolidation exceeds 6-8 weeks
- Volatility stops: Based on average true range calculations
Portfolio Hedging:
- Correlation analysis with Bitcoin and Ethereum
- Sector rotation strategies within DeFi tokens
- Options strategies for downside protection
Future Outlook Beyond 2025
Long-term Technical Projections
Chainlink price predictions suggest new all-time highs in the period 2026-2028. This aligns with broader cryptocurrency adoption cycles and technological development timelines.
Extended Price Targets:
- 2026: $50-75 range potential
- 2027-2028: New all-time high above $85
- 2030: $196.53 to $244.09 forecasted range
Technology Development Impact
Upcoming technological developments that could influence price:
- Cross-chain oracle solutions
- Enhanced data feed capabilities
- Integration with emerging blockchain networks
- Improved scalability solutions
Conclusion
The Chainlink price chart analysis for 2025 reveals a cryptocurrency at a critical juncture. With key support firmly established between $22-24 and significant resistance in the $27-30 range, LINK presents both opportunities and risks for different types of market participants.
Current technical indicators suggest a neutral-to-slightly-bullish bias, supported by a strong upward-sloping 200-day moving average trend since January 2025. The consolidation phase between $22.91 support and $24.76 resistance is likely to resolve with a directional move in the coming weeks
Read more: Best Chainlink LINK Trading Platform 2025: Your Complete Trading Guide